PARTNER NEWS:Thu, May 2, 10:51 AM, Zacks
AIG Beats on Q1 Earnings on Lower Costs, Approves Dividend Hike
Higher premiums and deposits in the Life and Retirement unit, and reduced catastrophe losses aid AIG's Q1 results. Management sanctions an increase of up to $10 billion in its buyback authorization.
Thu, May 2, 8:44 AM, Zacks
American Financial (AFG) Q1 Earnings Miss on Higher Expenses
American Financial's (AFG) first-quarter results reflect a decline in investment income, lower underwriting profit, higher expenses and catastrophe losses, offset by improved net earned premiums.
Featured MNV Articles: SLG Makes Notable Cross Below Critical Moving Average
Friday, October 20, 11:08 AM ET, by Market News Video Staff
In trading on Friday, shares of SL Green Realty Corp (SLG) crossed below their 200 ...
Notable Friday Option Activity: SLG, SRPT, HD
Friday, October 20, 3:25 PM ET, by Market News Video Staff
Among the underlying components of the Russell 3000 index, we saw noteworthy options trading volume ...
SL Green Realty Becomes Oversold
Wednesday, October 25, 4:05 PM ET, by Market News Video Staff
The DividendRank formula at Dividend Channel ranks a coverage universe of thousands of dividend stocks, ...
Ex-Dividend Reminder: Alliant Energy, Tanger Factory Outlet Centers and SL Green Realty
Thursday, October 26, 10:47 AM ET, by Market News Video Staff
On 10/30/23, Alliant Energy Corp (LNT), Tanger Factory Outlet Centers, Inc. (SKT), and SL Green ...
Notable Thursday Option Activity: RILY, IIPR, SLG
Thursday, November 2, 3:36 PM ET, by Market News Video Staff
Looking at options trading activity among components of the Russell 3000 index, there is noteworthy ...
|
| SLG Makes Notable Cross Below Critical Moving Average
By Dividend Channel Staff, Friday, October 20, 11:08 AM ET
In trading on Friday, shares of SL Green Realty Corp (NYSE:SLG) crossed below their 200 day moving average of $31.52, changing hands as low as $31.32 per share. SL Green Realty Corp shares are currently trading off about 0.3% on the day. The chart below shows the one year performance of SLG shares, versus its 200 day moving average:
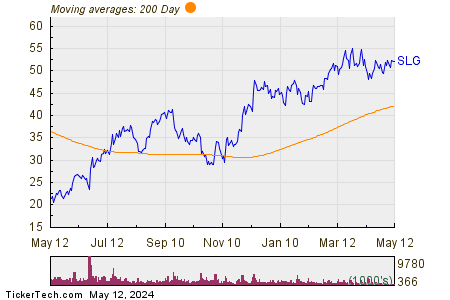
Looking at the chart above, SLG's low point in its 52 week range is $19.0601 per share, with $44.65 as the 52 week high point — that compares with a last trade of $31.62.
Special Offer: Receive our best dividend ideas directly to your inbox each afternoon with the Dividend Channel Premium Newsletter
This Article's Word Cloud:
Average
Below
Channel
Corp
Crossing
Dividend
Friday
Green
Looking
Moving
NYSE
Newsletter
Offer
Premium
Realty
Receive
Special
Start
Stocks
Their
about
above
afternoon
average
below
best
changing
chart
compares
crossed
currently
directly
dividend
each
hands
high
ideas
inbox
last
mdash
moving
performance
point
range
raquo
share
shares
trading
week
with
|
